Add a Progress Bar Column
A SharePoint Online tutorial by Peter Kalmström
 A
progress bar shows how much of task that has been done.
Such a graphical element it is a nice addition to a Tasks
or Issue Tracking list, and itcan be added in multiple ways. A
progress bar shows how much of task that has been done.
Such a graphical element it is a nice addition to a Tasks
or Issue Tracking list, and itcan be added in multiple ways.
In the demo below Peter Kalmström, CEO and Systems Designer
of kalmstrom.com Business Solutions, shows an easy way to
add a progress bar to a SharePoint list. Instead of creating
a script himself, he uses a piece of JSON code from the
open-source developer platform GitHub:https://github.com/pnp/List-Formatting/tree/master/column-samples/number-conditional-progress-color.

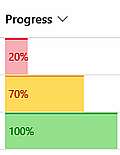
This progress bar visualizes the progress with bar size
and color. When less than 30% of the task is set to performed,
the color is red. Between 30% and 100% the color is yellow,
and when the task is completed the progress bar becomes
green.
The progress bar is placed in its own Number column (called
Progress in the image to the right). In the item form, users
set the percentage performed as tenths of one, that is,
from 0,1 for a task that is just started to 1,0 for a completed
task.
- Open the GitHub site with the link above.
- Copy the JSON code.
- Add a Number column in the list that should have
the progress bar.
- Open the List settings and then the column you added.
- Paste the JSON code in the Column formatting box
and Save.
- To test the progress bar, create a few items and
set the progress to different values.
|