Automate Chart Updates on SharePoint Page
A SharePoint Flows tutorial by Peter Kalmström
 Charts
added to SharePoint pages are often informative and interesting
– but only as long as the are updated with the latest data. Charts
added to SharePoint pages are often informative and interesting
– but only as long as the are updated with the latest data.
In the demo below Peter Kalmström, CEO and Systems Designer
of kalmstrom.com Business Solutions, shows how to build
a flow that takes care of the update. The flow is connected
to two lists: one that the chart builds on and one that
performs the calculation needed for the update of the Quick
chart web part.
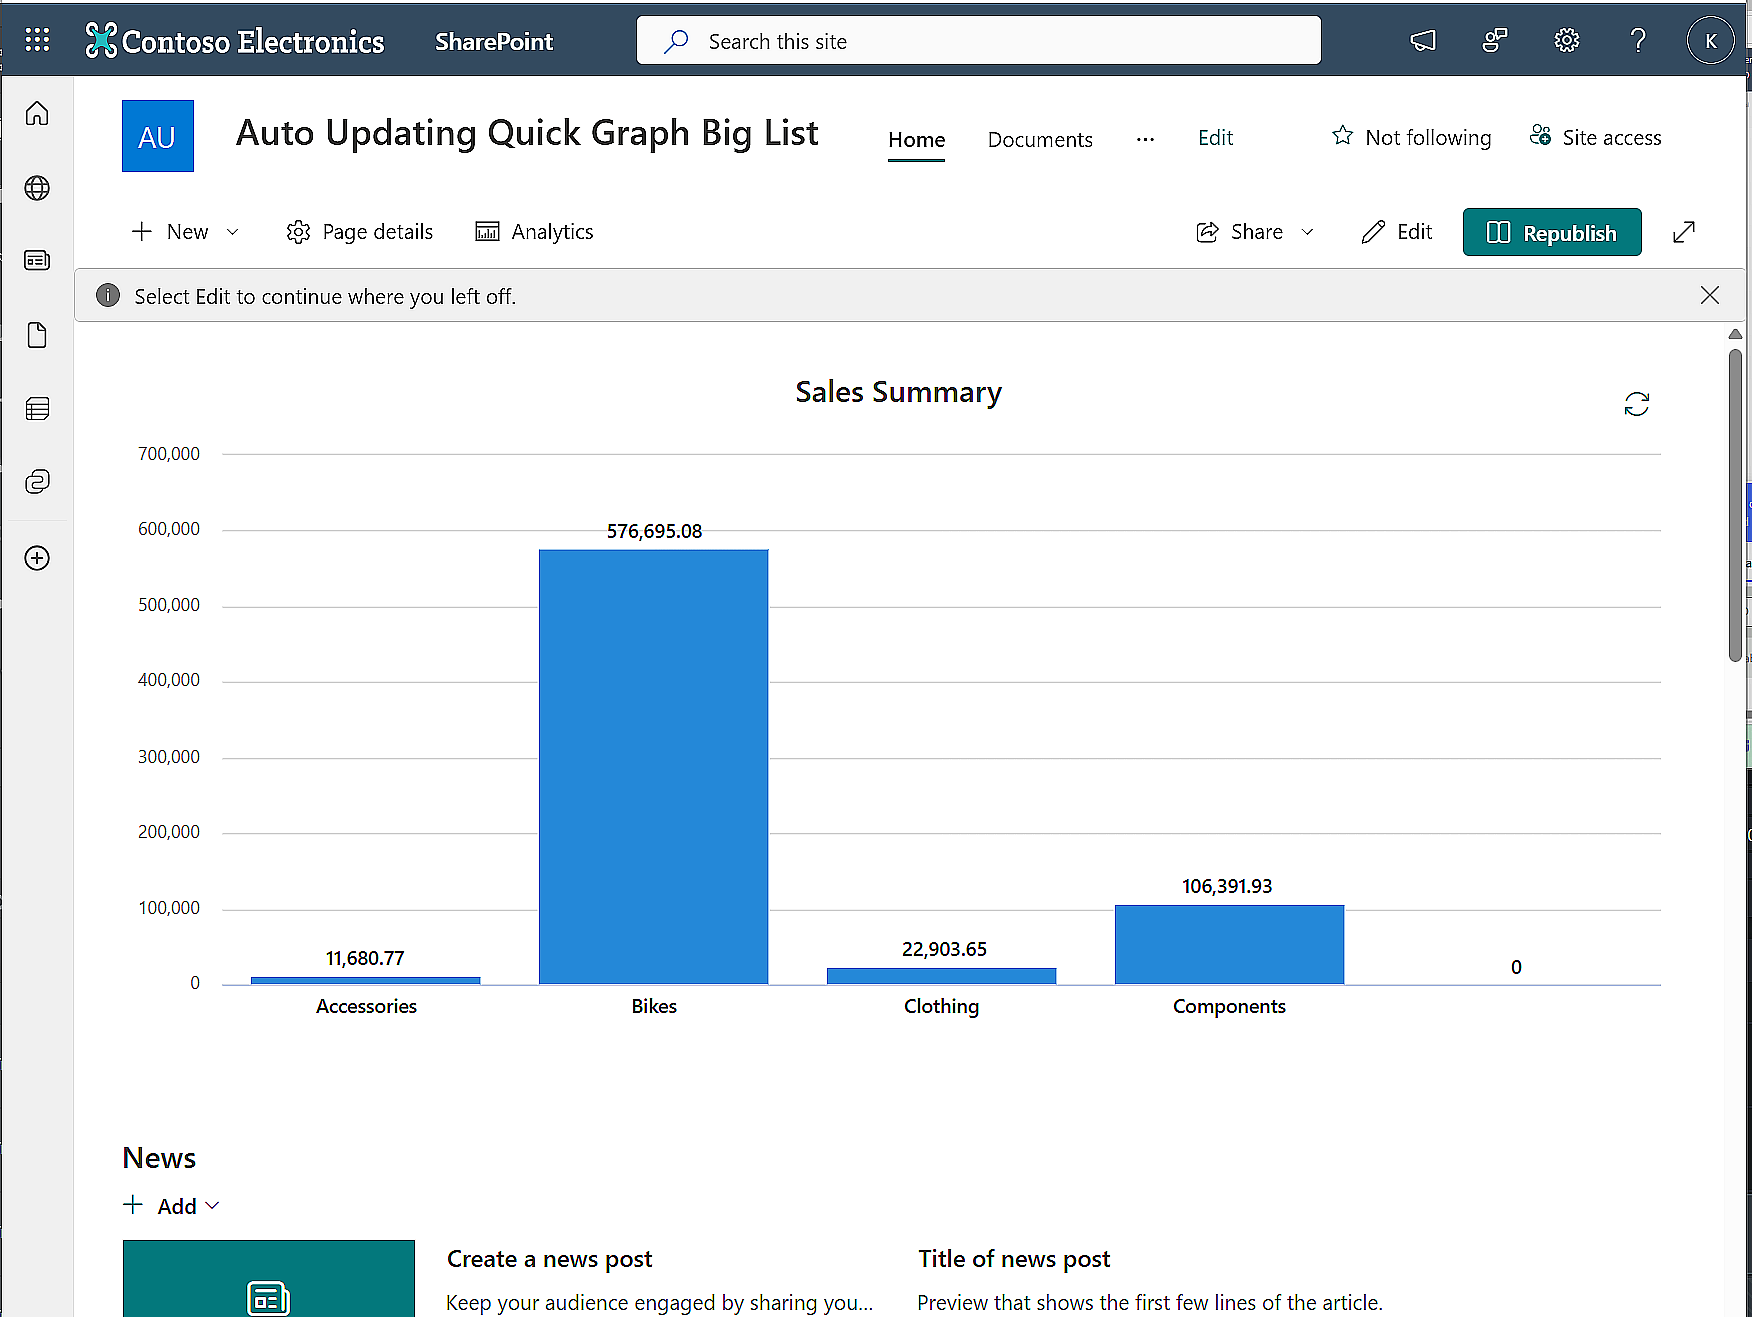
As an example, Peter uses a chart that builds on a SharePoint
list with data from bicycle sales. To just add the data
from the LineTotal column to the chart gives a cluttered
chart that is difficult to analyze. To display the sales
figures per category gives a better overview. Peter shows
how this would look with hardcoded data, but this data will
be replaced by figures calculated by a flow.
Thus, Peter creates a second list, SalesSummaries, that
has the four categories from the BicycleSales list in the
Title column and the sales numbers for each category in
a currency column. These sales numbers are the ones calculated
with a flow. To summarize the LineTotal values for each
category, they must be converted first into a JSON object
and then into XML.

Trigger
The flows start is an automated blank flow that uses the
trigger 'SharePoint - when an item is created or modified
for the BicycleSales list.
Flow actions
- SharePoint- Get items for the BicycleSales
list. Filter the items by Title eq '[the dynamic
content Title from the trigger]'.
- Data Operation - Select from the dynamic
content body/value of the Get items action. Switch to
text mode and add the dynamic content LineTotal from
the Get items action.
- Data Operation - Compose. As Input, create
a JSON object from the Numbers array and the Output
from the Select action: {"root":{"Numbers":[the dymanic
content Output]}}
- Variable - Initialize variable. Peter names
the variable SalesSummary and makes it float in case
there are decimals. The value will be calculated with
an expression that converts the JSON to an Xpath object:
xpath(xml(outputs('JSON')),'sum(/root/Numbers)').
- SharePoint - Get items for the SalesSummaries
list. Filter the items by Title eq '[the dynamic
content Title from the trigger]'.
- SharePoint - Update item for the SalesSummaries
list. The Id value should be the dynamic content ID
from the Get items action. Update the Sales column with
the dynamic content for the SalesSummary variable.
Test
Test the flows by adding a new column in the SalesSummaries
list and give it a value for one item in each category.
That way, you don't need to touch the existing data. Make
sure that the chart is updated correctly.
|